Creating a Basic Candlestick Chart in Report Builder 3.0
May 29th, 2010
Candlestick is a pretty useful technical indicator for trading equities. Some people built business around it. And it is pretty straightforward to create candlestick charts in Report Builder 3.0 (RB3.0) for reporting services. Today I’ll give a five-minute walkthrough of how to do it in RB3.0.
Data Preparation
- Download data from Yahoo.
- The download is usually a CSV file, save it on disk, use SQL Server Management Studio to import the data into a database table (e.g., table SPY under database AdventureStocks. Make sure that data types of the columns are updated appropriately (the default is string).
Create Report
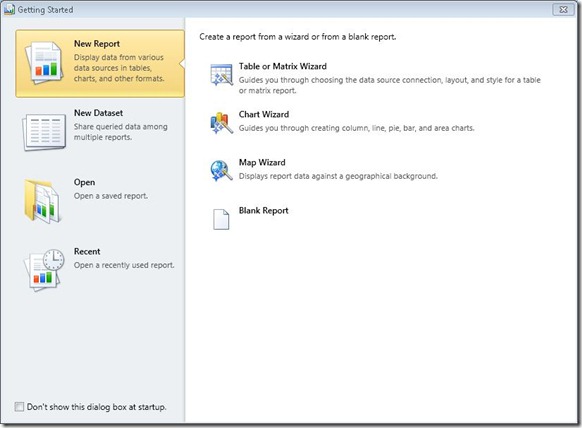
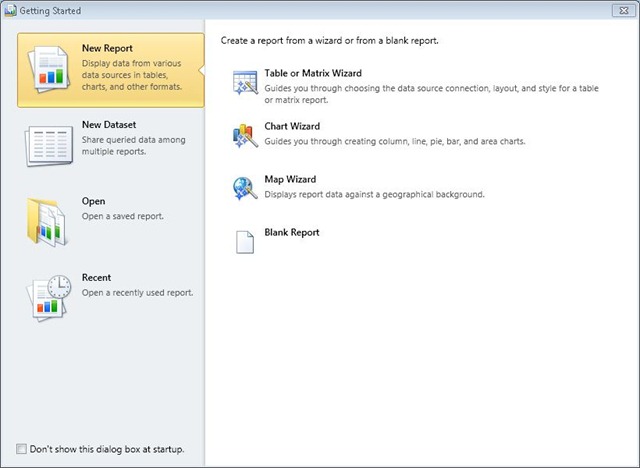
- Start RB3.0, pick “New Report”.
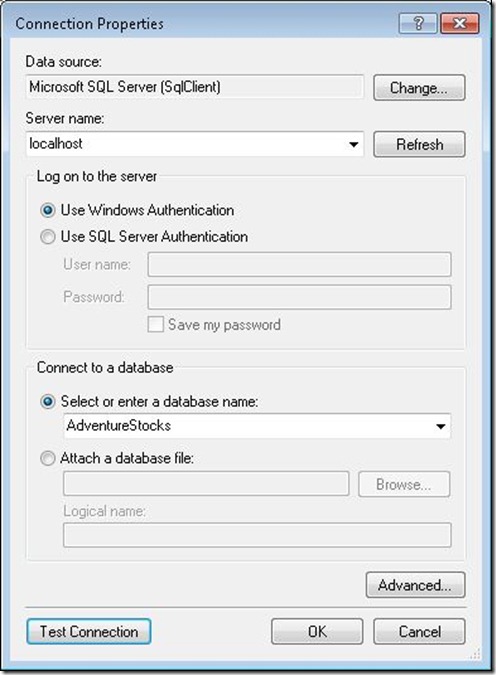
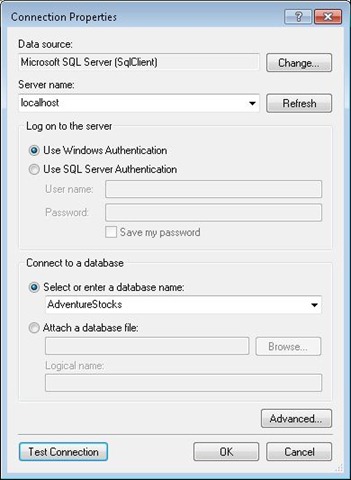
- Create a new data source connecting to the database on localhost.
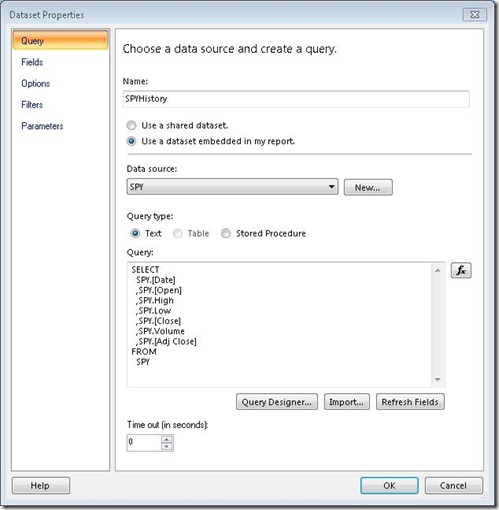
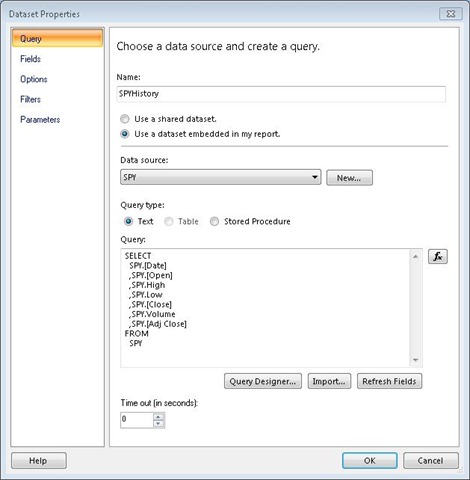
- Create a dataset from querying the SPY table.
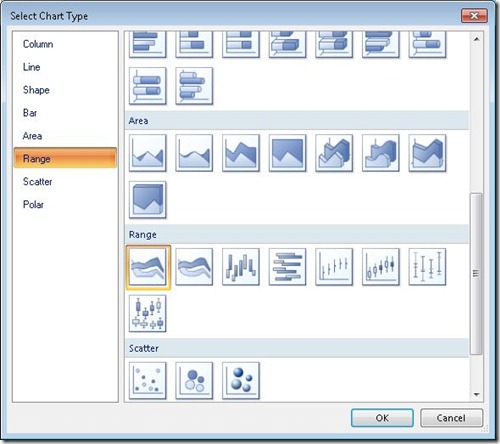
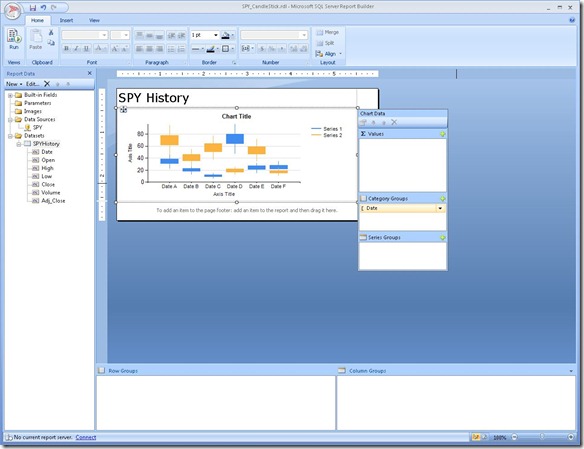
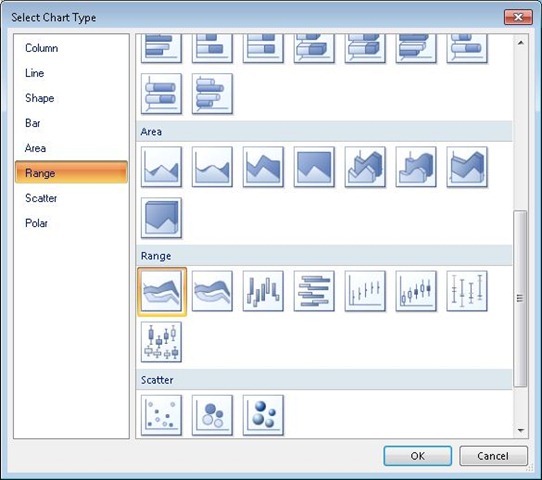
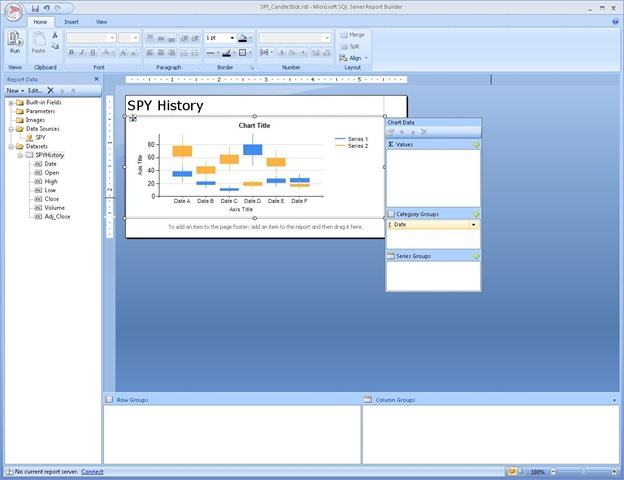
- On RB3.0 canvas, insert chart, select “Candlestick” under “Range” type.
- Drop “Date” to X axis and it will show up in “Category Groups”.
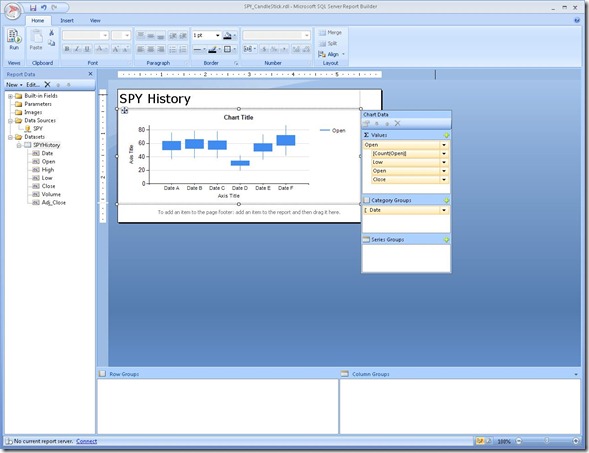
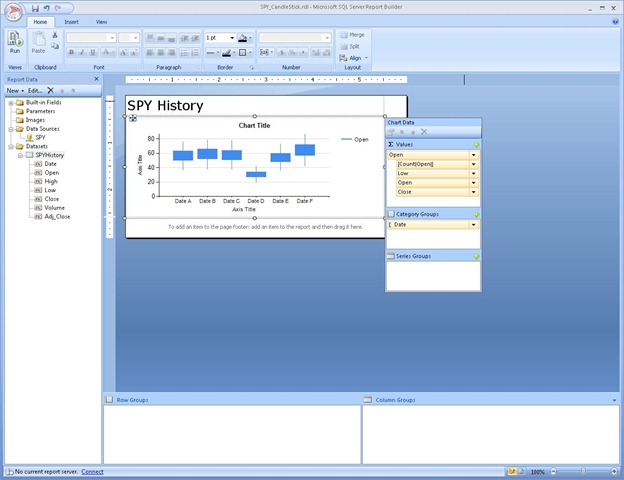
- Drop “Open” to “Values”.
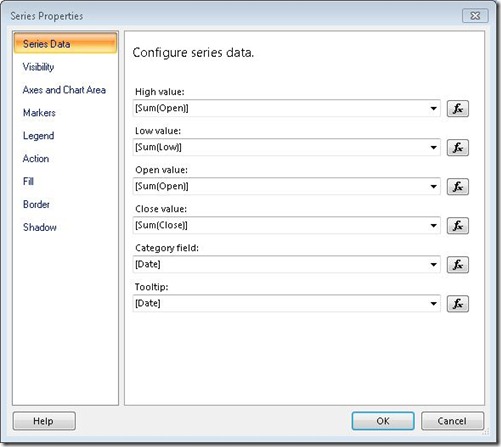
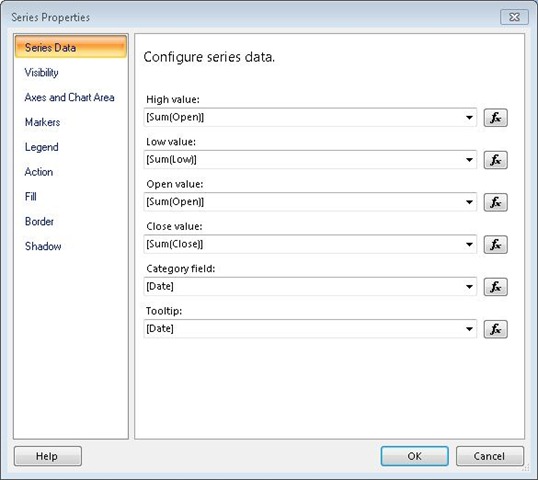
- Select data series on chart and configure its properties as follows:
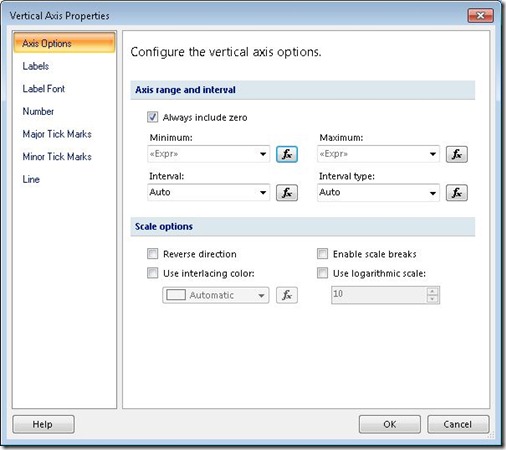
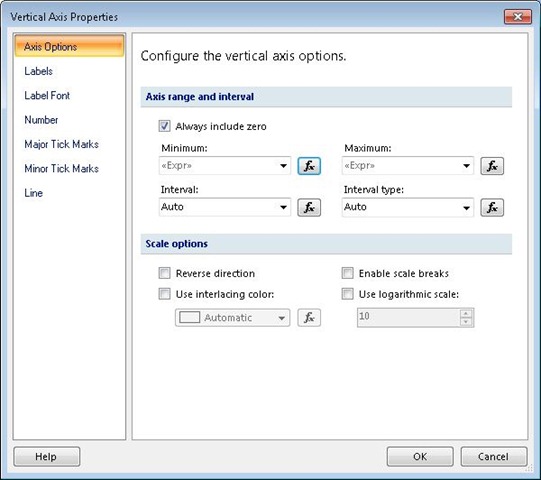
- Adjust Minimum and Maximum axis values in Vertical Axis Properties to fit with the OLHC values of SPY.
- Preview the report and it is all set.
Categories: Report Builder 3.0, Reporting
Recent Comments