Archive

Author Archive

Investment Ideas from Daily Life

December 14th, 2014 Comments off

[Disclaimer: The opinions expressed herein are my own personal opinions and do not represent my employer’s view in any way. This post is provided “AS IS” with no warranties, and confers no rights.]

I never failed to amaze me how much you could get out of a Coursera course. For example, last quarter there was this course called "Computational Investing I", which teaches quantitative approaches to investment. It is one of the best classes I took, ever. It covers basics of event study, market simulation, back testing, and technical indicators like Bollinger Bands. It laid a good foundation for people who want to do their own quantitative analysis using Python, and for further study.
If you pay enough attention, good ideas will find their way to you. It is no exception in personal investing. This course opened my ideas to some personal experiences that stood out in the past.

I’ll start with an example that happened recently. I was taking an online class from a prestigious technology giant (whose name I shall not disclose). These online classes are highly popular and in high demand, as it offers the ultimate flexibility of taking it within a few weeks of time, it boasts of some hands on labs, and of course, it is priced very close to those in-person live training classes. In a nutshell, it is a very high margin business, which probably explained the high flying stock price after IPO and its high P/E. The class was pretty good, until I started to do the labs. The lab server went down every couple of hours. I diligently submitted support tickets, followed up with phone calls with support to get the issue resolved. It was good for another day, but then it kept going down again and again afterwards. I got on the phone with support for hours, and finally got it resolved, so the server stayed up until I was done with the training. It occurred to me that it was pretty bad customer experience, and this experience cast serious doubt on the high availability features of their products, and I would to that far to say that this company was struggling with some serious internal issues as well. It was probably a coincidence, but it came as no surprise that this stock dropped like a rock in the months after that.


Another example was an online travel service I’ve been using since I started my professional life more than a decade ago. I really liked their service, and the prices they offered were unheard of from any discount/loyalty program for the hotel chains. Best of all, they constantly exceeded my expectations on multiple occasions that I had to cancel trips in the last minute (e.g., when snow storm hit the unprepared airports and caused flight cancellations). On hinder sight, this was really a great company that treated their customers well. And I had no reason to think that it would not to enjoy a epic uptrend like the chart below shows:


So what is the takeaway here? I am not in a position to give out investment advice here, nor should you, my friends, take it seriously as investment advice. But it is clear to me if a company treats their customers well, its value will go up, defying gravity. On the other hand, if a company doesn’t build solid services or products, the fall of value in its stock is inevitable. It is just common sense, and one doesn’t need to read 100 books on management to come up with this conclusion.
This is just an example of reflection on life experiences will enable us to gain insight into personal investment in stocks. With such insight in mind, building a quantitative strategy for equity investment would not be that hard, but I would not bore you with the details here.
Categories: Finance Tags:

Super Bowl XLVIII Prediction: a Bogus Data Science Approach

January 31st, 2014 Comments off

Needless to say, it has been a great season for Seahawks.  Seahawks is going to square it off with Broncos on Sunday for the Super Bowl! It is the second time Seahawks ever got into the championship game, and it is really exciting (even though I do not follow NFL in general, as a resident in Greater Seattle Area, I am really excited).  Will Seahawks do better this year and bring home the Vince Lombardi trophy?

The short answer is, sure, the odds are definitely favoring Seahawks. Chances are very good that Seahawks will win this game.

First off, Broncos didn’t have a very good track record of winning the Super Bowl.  Broncos got in 6 times in the past, and won only 2 of them.  Odds of winning? 1/3. Not so good. It tied with Patriots and Vikings in terms of the number of games lost. Maybe their odds is a tad better than those of the teams like Vikings, Bills, Bengals, Eagles, Chargers, Falcons, Titans, Panthers or Cadinals which never won a Super Bowl, but the odds of winning is definitely not favoring Broncos.

Second off, Broncos has never won a Super Bowl game before in a year of Horse. Super Bowl XXIV was held on 1/28/1990, which was two days into the year of Horse by lunar calendar. Broncos lost to 49ers 10:55, the widest loss ever in Super Bowl history. Even a game held anywhere near the year of Horse is bad for Broncos, e.g., Super Bowl  XII, Broncos lost to Dallas Cowboys 10:27. The game was held 1/15/1978, a few weeks before the official start of the year of Horse. That said, year of the Horse never bode well with Broncos before. And misinformed commentator from Denver was hopeful that Broncos will win because of the year of the Horse. Based on past performance, the chances are very slim. Why? If you know something about the Chinese zodiac, you would know that year of the Horse is called a year of “original zodiac year” (OZY) for anything associated with horse. And in an OZY, there potentially could be lots of bad luck, which could only be mitigated by wearing a red waist belt.  I bet the players on Broncos don’t know enough to wear the much needed red waist belt!

That said, I have every reason to believe that Seahawks will win the game on Sunday.

Go Hawks!

Categories: Bogus Data Science Tags:

Most Friendly SNS for Firefox 2.0?

December 7th, 2011 Comments off

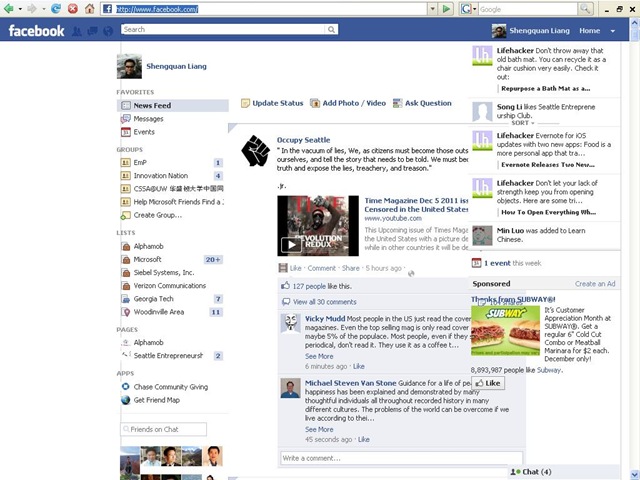
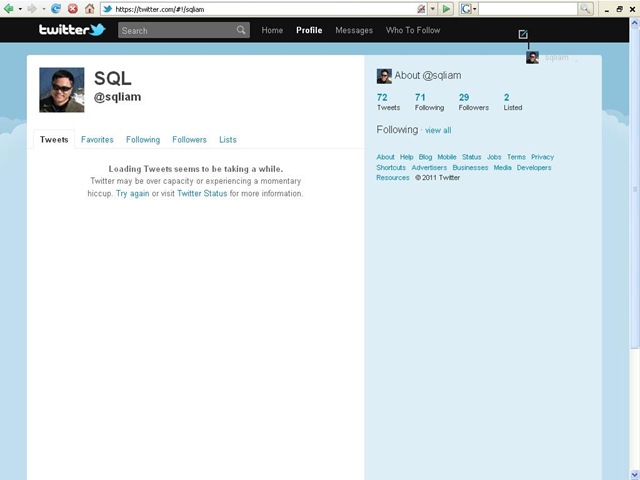
I know, I know, Firefox 2.0 is so yesterday. The latest is 8.x already. I happen to have a laptop running Windows XP SP1 with Firefox 2.0 for testing, and I sidetracked myself a bit surfing around for a few minutes on my frequently visited SNS sites:

  • Facebook

Facebook

  • Twitter

Twitter

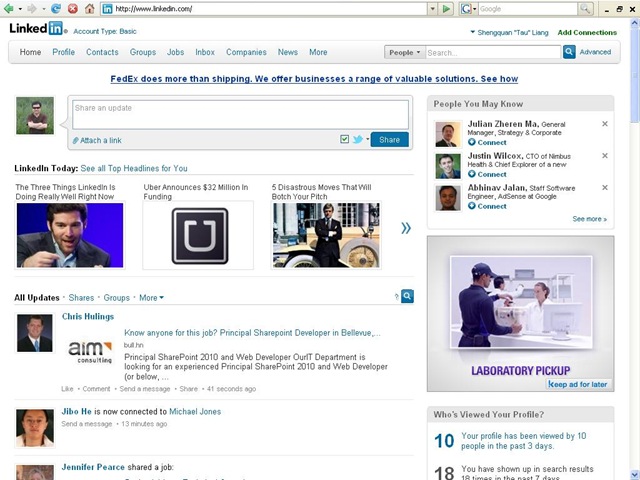
  • LinkedIn

LinkedIn

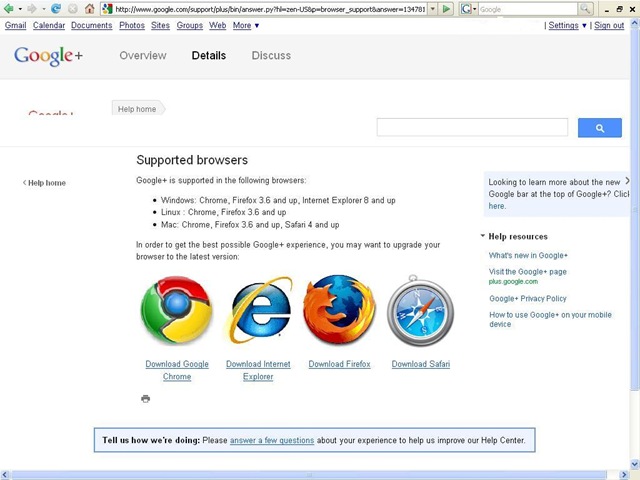
  • Google Plus
  • GooglePlus

    From the screenshots above, LinkedIn easily tops the most friendly SNS site for Firefox 2.0. No wonder it is my favorite.
Categories: Nagging, Social Tags:

Crescent Went Public

July 13th, 2011 Comments off
Categories: Crescent Tags:

SSRS Denali Related Videos

May 25th, 2011 Comments off

What’s New in Microsoft SQL Server Code-Named “Denali” for Reporting Services

http://channel9.msdn.com/Events/TechEd/NorthAmerica/2011/DBI211

BI Power Hour

http://channel9.msdn.com/Events/TechEd/NorthAmerica/2011/DBI201

Categories: Crescent, Reporting Tags:

Future of Silverlight

November 15th, 2010 Comments off

Learn about the plans for the next version of Silverlight from Scott Guthrie.

http://www.silverlight.net/news/events/firestarter/

Categories: Silverlight Tags:

Project Crescent Unveiled on PASS Summit 2010

November 10th, 2010 Comments off

It is pretty exciting to see it announced to the general public.  It greatly simplifies the ways user interact with data. A teaser video is available online for a sneak preview of its capabilities.

Categories: Crescent, Reporting Tags:

Creating a Basic Candlestick Chart in Report Builder 3.0

May 29th, 2010 Comments off

Candlestick is a pretty useful technical indicator for trading equities. Some people built business around it. And it is pretty straightforward to create candlestick charts in Report Builder 3.0 (RB3.0)  for reporting services. Today I’ll give a five-minute walkthrough of how to do it in RB3.0.

Data Preparation

  1. Download data from Yahoo.
  2. The download is usually a CSV file, save it on disk, use SQL Server Management Studio to import the data into a database table (e.g., table SPY under database AdventureStocks. Make sure that data types of the columns are updated appropriately (the default is string).

Create Report

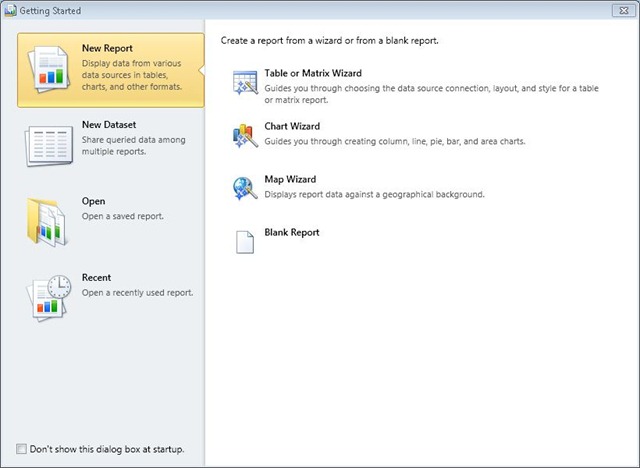
  1. Start RB3.0, pick “New Report”.6
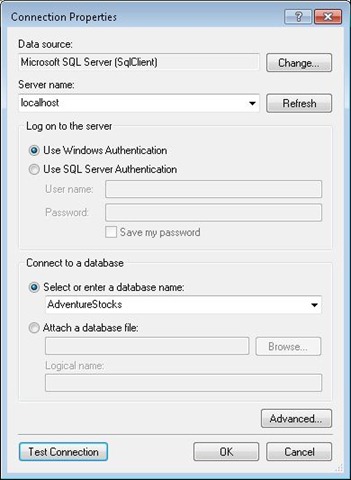
  2. Create a new data source connecting to the database on localhost.7
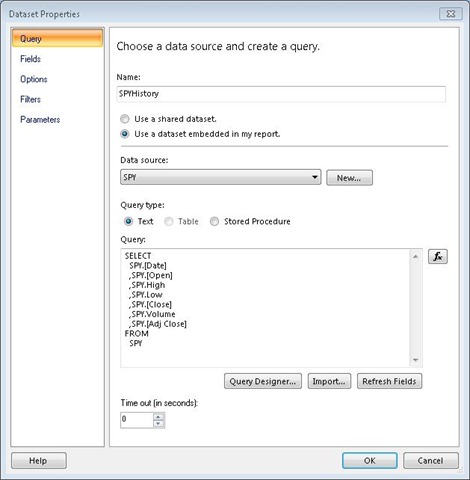
  3. Create a dataset from querying the SPY table.8
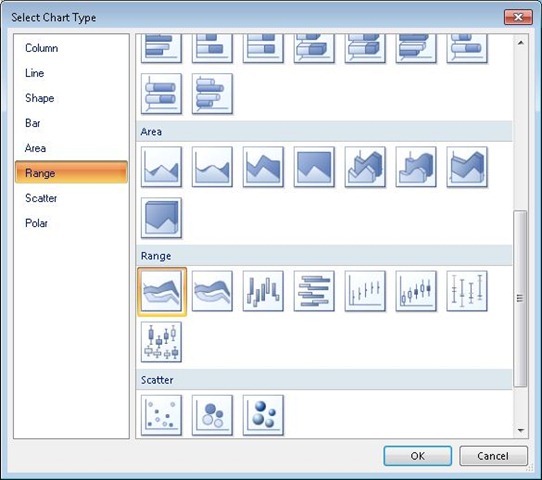
  4. On RB3.0 canvas, insert chart, select “Candlestick” under “Range” type.9
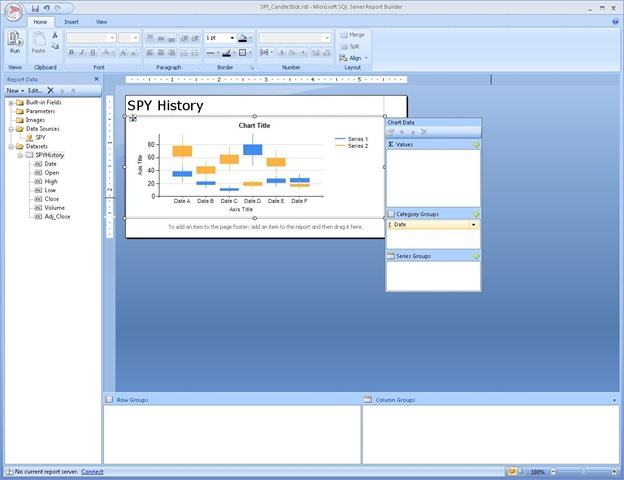
  5. Drop “Date” to X axis and it will show up in “Category Groups”. 10
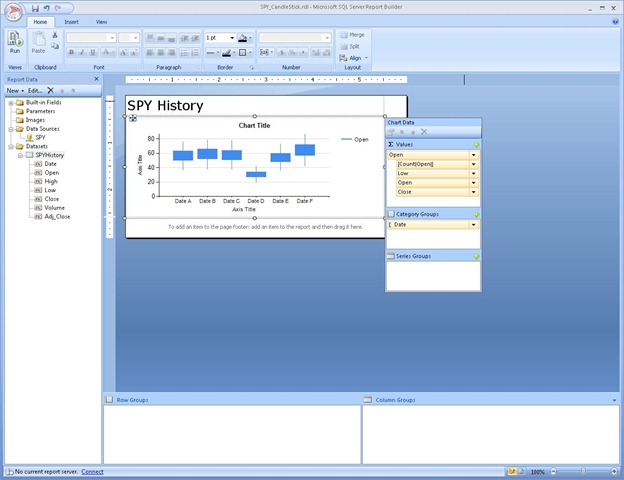
  6. Drop “Open” to “Values”.11
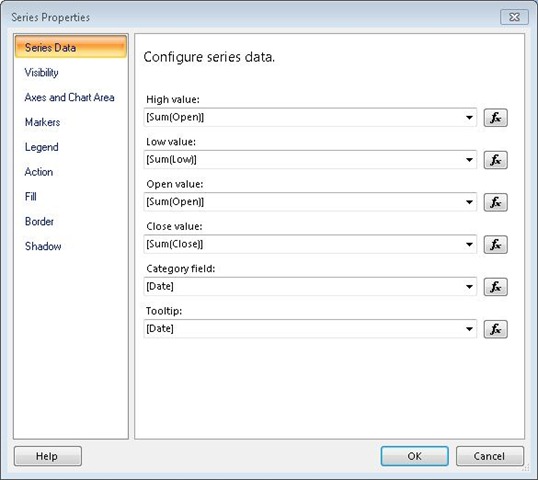
  7. Select data series on chart and configure its properties as follows:13
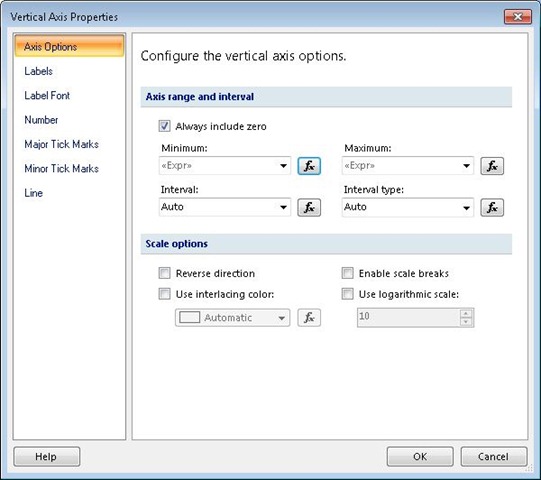
  8. Adjust Minimum and Maximum axis values in Vertical Axis Properties to fit with the OLHC values of SPY.14
  9. Preview the report and it is all set.
Categories: Report Builder 3.0, Reporting Tags:

Reporting Services Resources

May 20th, 2010 Comments off
Categories: Books, Reporting Tags:

Design Pattern Resources

May 20th, 2010 Comments off
Categories: Books, Patterns Tags: