Archive

Author Archive

“Could not open a connection to SQL Server” on SQL Azure Data Source

May 17th, 2010 Comments off

SQL Server Reporting Services 2008 R2 added support for SQL Azure data source. It is nice to have as this makes it easier to put one foot of your report into the cloud. Sometimes, report server throws this mysterious (and much dreaded) error:

A network-related or instance-specific error occurred while establishing a connection to SQL Server. The server was not found or was not accessible. Verify that the instance name is correct and that SQL Server is configured to allow remote connections. (provider: Named Pipes Provider, error: 40 – Could not open a connection to SQL Server)

It usually happens like this: report works in Report Builder, report works in BIDS, SQL Server Management Studio has no trouble whatsoever connecting to the data source, but, once the report is deployed to the server and when user tries to run it, out of the blue, this error jumps out.  As the message suggests, it is a network issue. Usually, the SQL Azure data source has to be access via a proxy (e.g., Reporting Services get to it through ISA client installed on the report server).  You can configure the Report Server service to run under any of these account types:

  • Least-privileged Windows user account
  • NetworkService
  • LocalSystem
  • LocalService

And the service account is the one being used to get across the proxy and reach out to the SQL Azure server sitting in the cloud.  If your reporting server is running behind the firewall, more often than not, only a “Least-privileged Windows user account” has permission on the proxy server to sneak out. Thus, if Report Server is using any of the other three as the service account, chances are good that it won’t be able to get hold of a connection to SQL Azure server. I hope the workaround is obvious to you at this point now, yes, set the service account to a least-privileged Windows user account which happens to have permission on the proxy server.
  1. http://technet.microsoft.com/en-us/library/ff519560%28SQL.105%29.aspx
  2. http://msdn.microsoft.com/en-us/library/ms160340.aspx

Building a Foreclosure Map

May 16th, 2010 1 comment

As a fan of data, I track foreclosure numbers as a hobby. Last month, nation wide default notices off by 27 percent, but bank repossessions set new monthly record. I don’t have any more detailed and recent data to plot an interactivity map like the one on NPR, but I managed to find some data from Q3 2009 on RealtyTrac. Let’s see how easy it is to build a map using Report Builder 3.0.

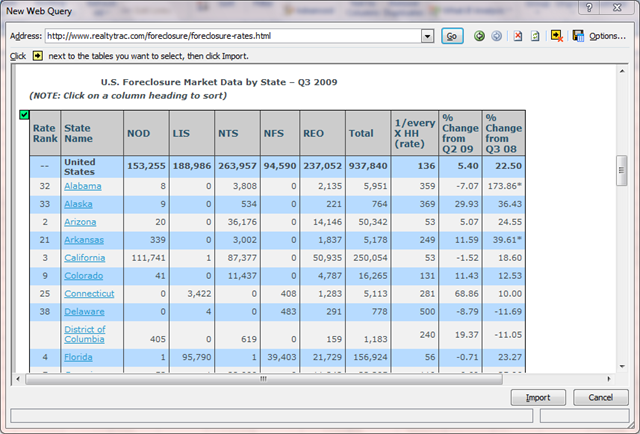
First, we’ll download the data from the source. Start Microsoft Excel and go to “Data”—>”From Web” and enter the URL in the address bar: http://www.realtytrac.com/foreclosure/foreclosure-rates.html. Scroll down to the “US Foreclosure Market Data by State – Q3 2009” table. Click on the arrow to select the table and import data.

image

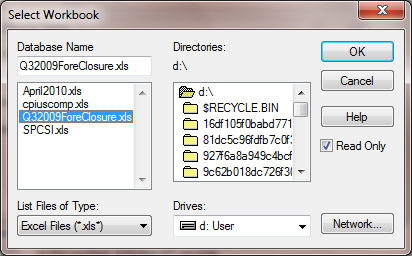
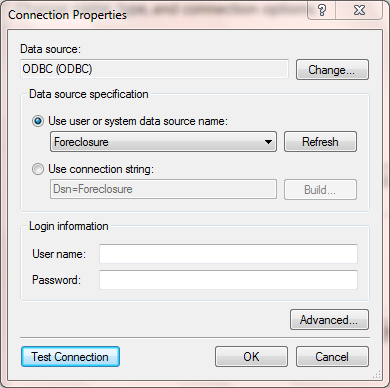
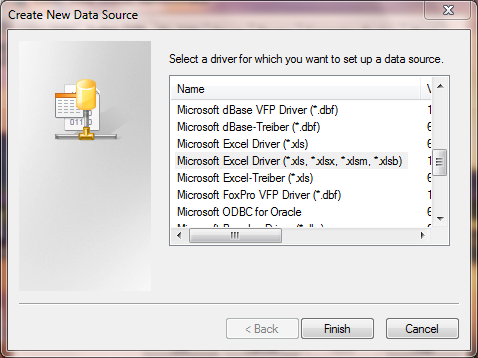
Second, save the file as an Excel 2000-2003 work book on disc, say, as Q32009ForeClosure.xls on D:\. Create a system data source named “Foreclosure” pointed to this file.

 imageimage

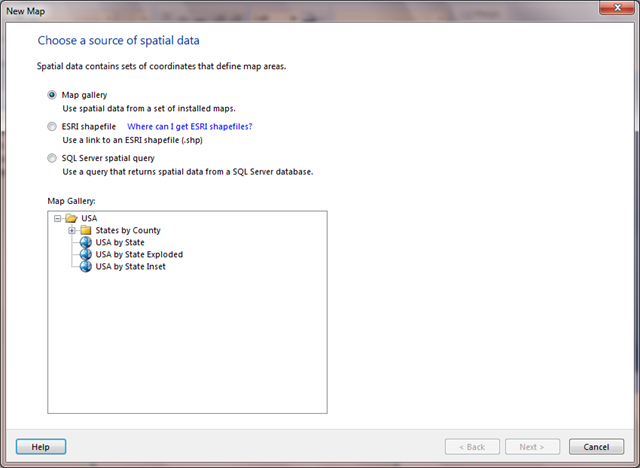
Now, we can launch Report Builder 3.0 to start the Map Wizard. Select “USA by State Inset”. Select defaults on next screen.

image

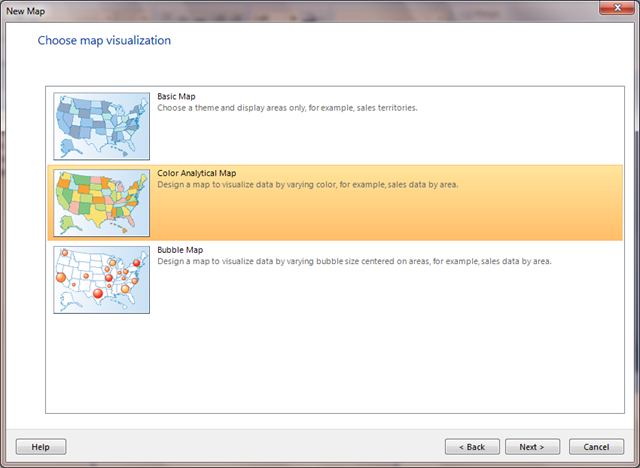
And pick Color Analytical Map on next screen.

image

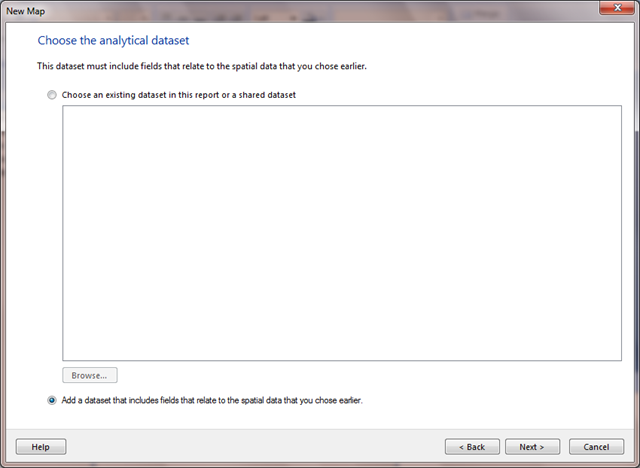
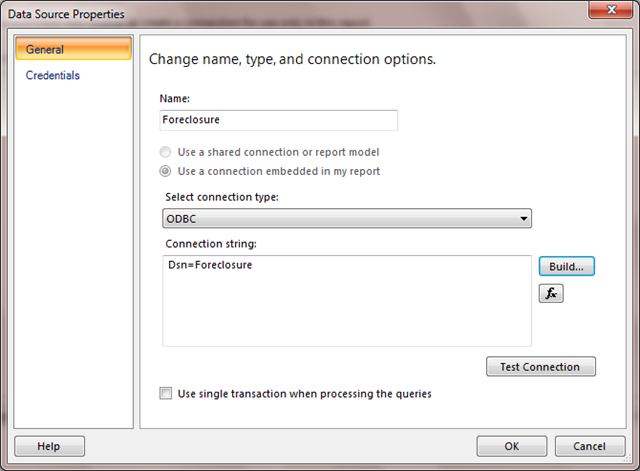
Add a new analytical dataset based on data source “Foreclosure”

image

image

image

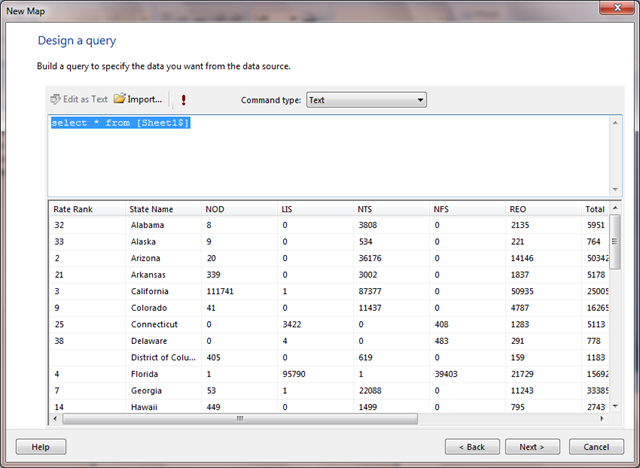
Run query “select * from [Sheet1$] to make sure that it works.

image

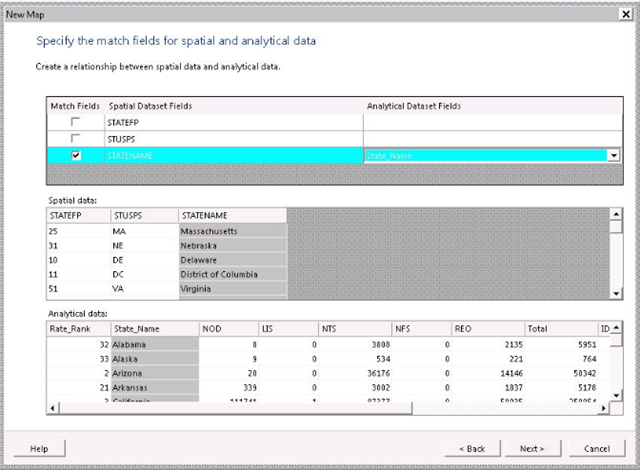
And specify the matching fields for spatial and analytical data. In this case, the field in spatial dataset is “STATENAME” and the field in analytical dataset is “State_Name”.

image

Pick the theme, as well as the field to visualize, and the color rule. Get rid of the legends etc and leave only the color scale on the map. Add title “Foreclosure Map”.

image

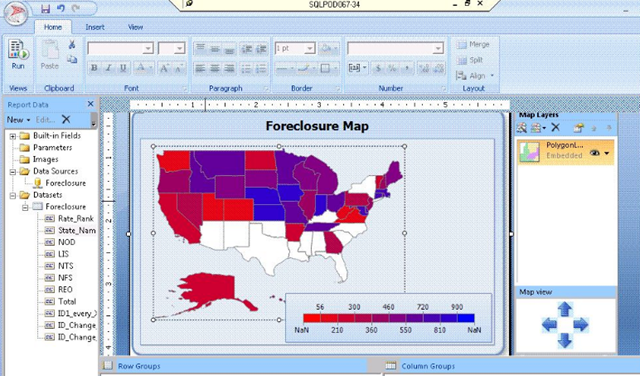
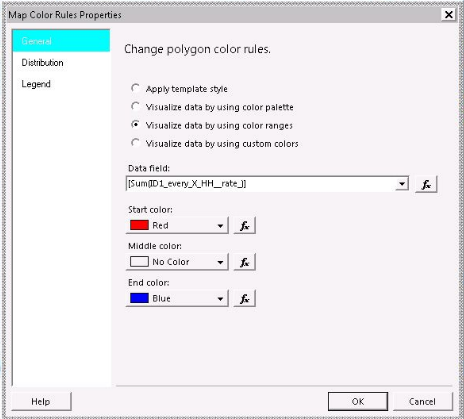
Click on the map, a property panel will show up on the RHS. Right click on “Polygon Layer” and select “Polygon Color Rule”. Make sure that the correct data field is picked, start and end colors are right. In the case we have, we’ll start with something red and end it with blue as the smaller the number, the more severe foreclosure condition is in the state. Change the “Distribution” to have 10 subranges, with them starting at 0 and ending at  3000.

image

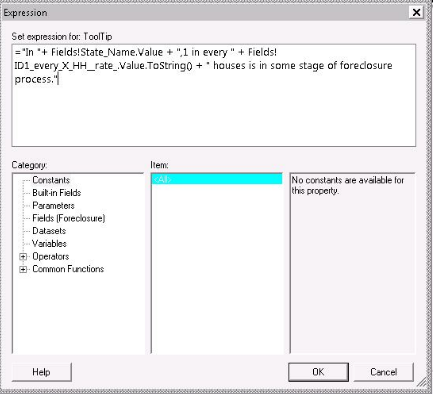
Want to see some tooltips? Go to “Polygon Properties”—>”General” and add it there. Let’s add something like

   1: ="In "+ Fields!State_Name.Value + ",1 in every " + Fields!ID1_every_X_HH__rate_.Value.ToString() + " house is in some stage of foreclosure process."

image

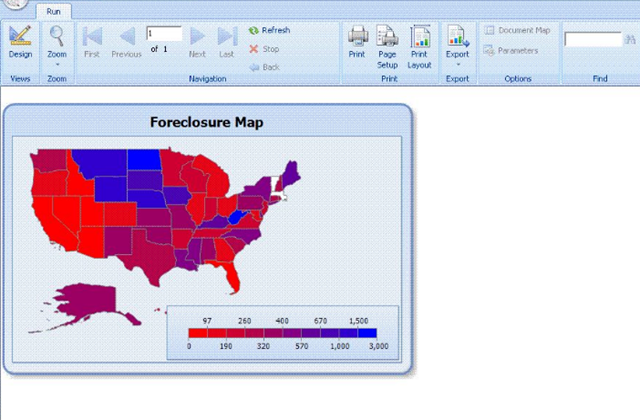
Hit the “Run” button to get a preview. Hover the mouse on some of the states to check out the tooltips.

image 

In less than five minutes, we build this colorful map visualizing the foreclosure conditions in different states across the US. The completed RDL file along with the Excel data file is available in archived format here.

Data Reference

  1. http://www.microsoft.com/downloads/details.aspx?familyid=6ccd8427-1017-4f33-a062-d165078e32b1&displaylang=en
Categories: Report Builder 3.0, Reporting Tags:

Report Builder 3.0 RTM is Available for Download

May 13th, 2010 Comments off
Categories: Report Builder 3.0, Reporting Tags:

Succeeding with Agile

May 5th, 2010 Comments off

Just like Mike Cohn’s previous books, Succeeding with Agile: Software Development Using Scrum is an instant classic on this topic. It is not just a book about scrum, it has tons of information about how software development teams could improve their development process. This book starts with an introduction on how teams could adapt scrum, then dives into details about how individuals, teams and organizations could be fundamentally changed and transformed with scrum.  Mike Cohn not only does an awesome job of showing readers the ins and outs of agile practices, but also explains how to make these changes happen in the real world and points out the paths to get around the pitfalls and obstacles.

Having worked with scrum in the past for a few years and now picked it up again on my current team, I found this book not only a great pleasure to read, but also extremely insightful and practical.  Just a few things I found particularly interesting:

  1. Sources of Organizational Gravity (Pages 38-40): HR, Marketing, Finance.
  2. The How’s and Why’s of Individual Resistance (Pages 104-114): Diehards, Saboteurs, Followers, Skeptics.
  3. A team’s time demands on their product owner and ScrumMaster move in different directions (Page 128): as the team moves faster, they will need more time from product owner.
  4. Why two pizzas are enough (Page 178)
  5. Embrace whole-team responsibility (P201)
  6. The right level of detail (P308) on testing
  7. Acknowledge significant cultural differences (P359). This is the one of the few books I ever read about software development process that actually talk about this.  A reasonably sized development team usually involve people from a diversified set of culture backgrounds. It will be advisable to be aware of this and deal with it. I picked a few countries of interest from the link on this.
    Country PDI IDV MAS UAI LTO
    Brazil 69 38 49 76 65
    China * 80 20 66 30 118
    France 68 71 43 86  
    Germany 35 67 66 65 31
    Hungary * 46 80 88 82 50
    India 77 48 56 40 61
    Iran 58 41 43 59  
    Israel 13 54 47 81  
    Poland * 68 60 64 93 32
    Romania * 90 30 42 90  
    Russia * 93 39 36 95  
    Thailand 64 20 34 64 56
    United States 40 91 62 46 29

    Let me end the review with a quote in the book from Peter Drucker:

    Every organization must be prepared to abandon everything it does to survive in the future.

    It sums it all. If you want to learn about how to improve the way how software is built, this is the book to have.

  1. http://www.geert-hofstede.com/hofstede_dimensions.php
Categories: Agile, Books Tags:

Microsoft SQL Server Reporting Services Recipes

May 2nd, 2010 Comments off
I got hold of the book Microsoft SQL Server Reporting Services Recipes from Amazon a few days back. I read through it, it is truly a special book. The book is co-authored by Paul Turley and Robert Bruckner with contributions from 9 other reporting services experts from around the world.

The book starts with basic concepts and essential techniques in report design with Reporting Services. Then it dives into 63 in-depth topics on advanced reporting design. The recipes are generally organized with several sections:

  1. Product versions that the recipe could be applied to
  2. What prerequisite skills needed
  3. How to design the report in a step by step recipe style
  4. Final thoughts on the recipe
  5. (When applicable) Credits and related references are listed at the end

This book was available just before SQL Server 2008 R2 went RTM in April. One thing of note is that quite a few recipes in the book use SQL Server 2008 R2 specific technology (such as domain scope, maps, aggregates of aggregates, and read-write report variables).

To sum it up, it is a great reference to those who want to create some non-trivial reports.

  1. http://blogs.msdn.com/robertbruckner/archive/2010/03/21/reporting-services-recipes-book-released.aspx
Categories: Books, Reporting Tags:

MVC and MVVM

May 1st, 2010 1 comment

Silverlight is making a new pattern MVVM more popular by the day.  At a first glance I thought it was just a different name for the good old MVC pattern. On second look, there are actually quite some differences between these two:

  • In MVC, controller is actively controlling the view
  • MVVM makes view an active participant, more like a presenter
  • In MVVM, ViewModel is passive, while View is active
  1. http://russelleast.wordpress.com/2008/08/09/overview-of-the-modelview-viewmodel-mvvm-pattern-and-data-binding/
  2. http://martinfowler.com/eaaDev/PresentationModel.html
Categories: Patterns Tags:

Building Portable Reports

April 29th, 2010 Comments off

In a rush? Laptop doesn’t have a solid network connection to corporate network for an important report for traveling executives? Make your report portable.

There are two not-so-often-mentioned easy ways to make your reports portable. Use embedded XML in report, or use an ODBC data connection to local data stores. More details could be found on MSDN.

  1. http://msdn.microsoft.com/en-us/library/aa337458%28v=SQL.90%29.aspx
  2. http://msdn.microsoft.com/en-us/library/ms156450.aspx
Categories: Reporting Tags: